Introducing StarTree ThirdEye: Anomaly Detection and Insights with Apache Pinot

Growing Data Volumes Present a Challenge and an Opportunity
Imagine a scenario in which your credit card is stolen, and the thief quickly uses it to spend a large amount of your money. Payment processor companies like PayPal keep tabs on the usage patterns of your card, including transaction amounts, transaction locations, and more. If there are unusual changes in the pattern of your credit card transactions, the company may freeze those transactions and inform you about them so you can take action to cancel your card.
This is an example of using the concept of anomalies to detect abnormal transactions in a stream of data — in this case, the use of your credit card before and after its theft.
Anomaly Detection is Getting Progressively Harder
With rapidly growing data volumes, it's nearly impossible for insight producers (the credit card company in our example) and consumers to keep track of all the real-time changes occurring in the data that can produce anomalous events. Thus, detecting interesting patterns, deriving meaningful insights, and making them actionable is a growing problem for many businesses.
The expansion of data results in a long time to detect and resolve outliers in that data and greater difficulty improving follow-on decision-making via actionable insights from detected anomalous events.
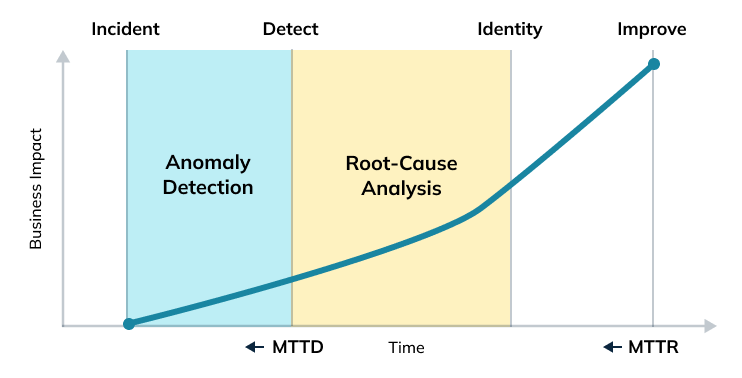
In Anomaly Detection, Minor Issues Can Have a Major Impact
The consequences of not being able to find "what went wrong with my data" promptly can be far more significant than anticipated. Even the most trivial-seeming errors in data can snowball into much bigger issues.
For companies like LinkedIn, which relies heavily on data to drive business growth, the consequences of not finding "what went wrong with my data" promptly can have a significant impact on the business. For example, a few years back, when business KPIs/metrics monitoring was still evolving at LinkedIn, the business operations team used to face delayed identification of blindspots while launching features on LinkedIn Feed. That oversight had led to a significant loss in ad revenue of about multi-million dollars/year. Several cross-functional teams — including data engineering, data science, and business operations — spent hours to weeks in a war-room set up to perform root cause analysis and resolve the issue.
At that time, the business operations team was monitoring critical ad-revenue KPIs such as ad revenue itself, number of clicks, impressions, and click-through rates by using dashboards plotting single or multiple metrics and threshold-based alerts. These dashboards didn’t identify trends and anomalies, so they couldn’t offer insight into what went wrong and why.
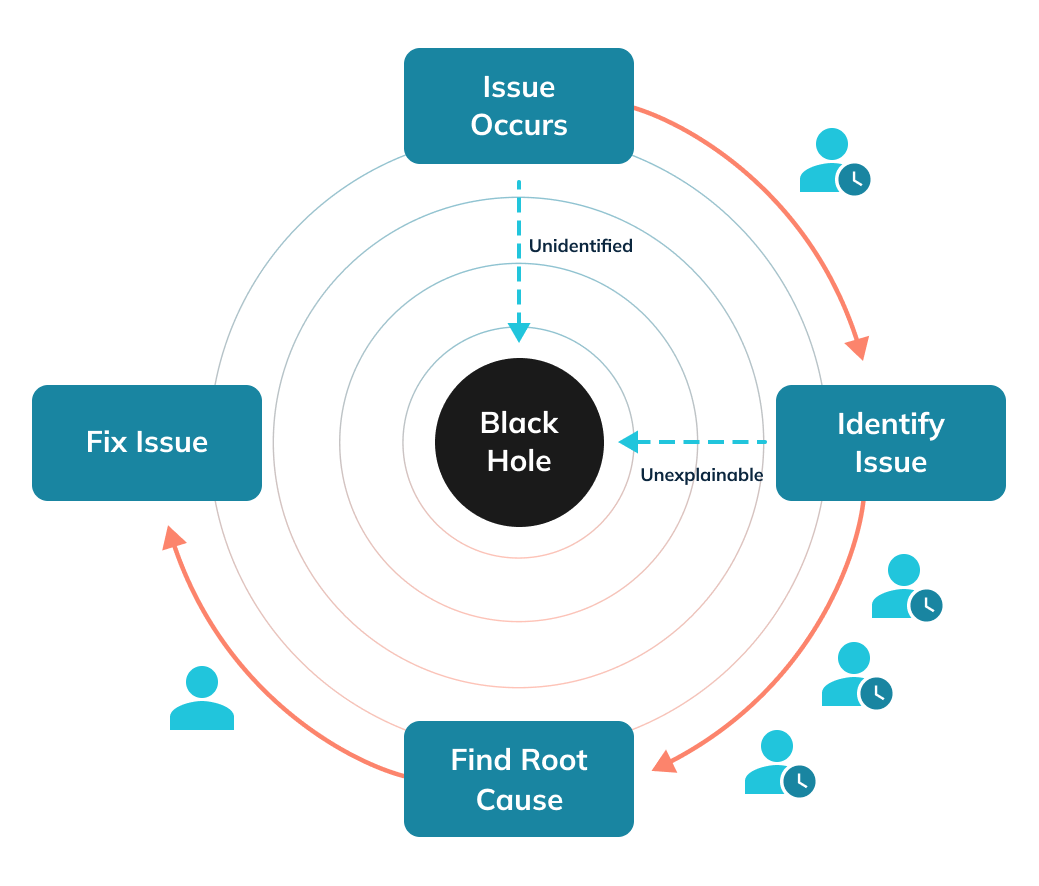
Lost Revenue was Not the Only Issue
Due to a lack of actionable insights from detected anomalous events, it took a long time for decision-makers to identify the exact issue and determine whether it was safe to launch the feed feature! By the time they could decide, there was already a significant loss to the business.
Further, the glitch slowed down LinkedIn's ability to run experiments to drive feed engagement. This impacted the fly-wheel effect of a social media platform in which the increase in feed engagement generates more leads to drive ad revenue growth.
The product analysts, data science, and business operations team faced a variety of challenges with dashboard monitoring and threshold-based alerts. Those included alert fatigue, data freshness issues, and an inability to view multiple elements together, like high-level metrics across offline historical data and real-time events.
Fast-Track Problem Solving and Decision Making with StarTree ThirdEye
In any data set, there are two types of anomalous data:
Known unknowns that are difficult to detect in a timely fashion
Unknown unknowns that are difficult to predict with basic reports, dashboards, and monitoring solutions
How can we convert these anomalous data into actionable insights?

What is StarTree ThirdEye?
StarTree.ai has built an anomaly detection system called StarTree ThirdEye. It has statistical anomaly detection methods, monitoring, and interactive root-cause analysis to convert the anomalous data into actionable insights. It empowers insight producers and decision-makers to fast-track problem-solving using actionable insights. StarTree ThirdEye anomaly detector:
can detect anomalies in rapidly changing data patterns in massive time-series data
can predict data patterns based on historical data patterns in time-series data
enables continuous monitoring of abnormal behavior across data volumes that would be impossible to track manually
What are the Benefits of using StarTree ThirdEye?
With StarTree ThirdEye's interactive root-cause analysis experience, users can fast-track problem-solving and improve decision-making with actionable insights from anomalous events. StarTree ThirdEye has the following features and benefits:
Leverage onboard metrics and KPIs from real-time and offline data
Detect anomalies faster and with better accuracy via smart anomaly detection and alerts
Fast-track problem solving with interactive root cause analysis, including dimensions drills and correlated metrics and events
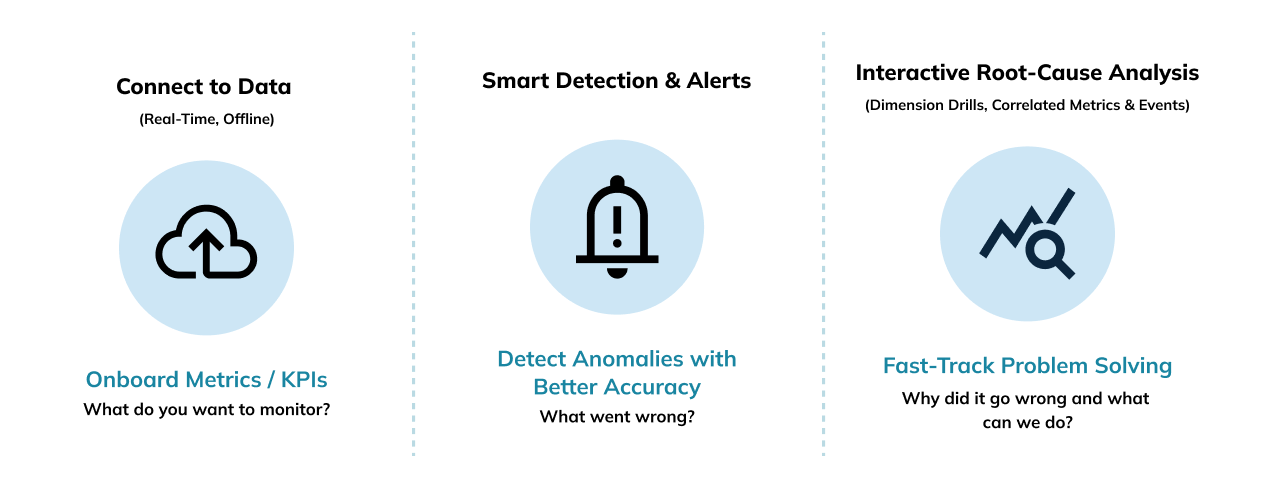
What's the Progression of Anomaly Detection and Resolution with StarTree ThirdEye?
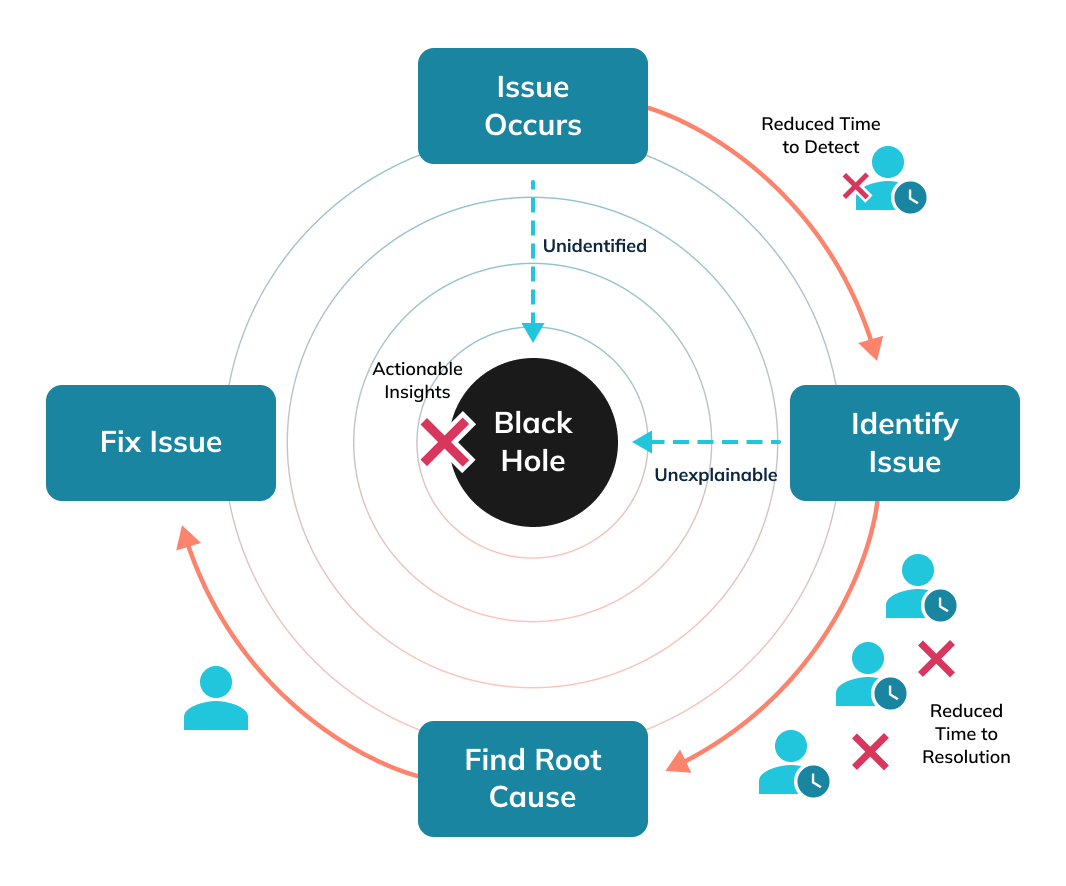
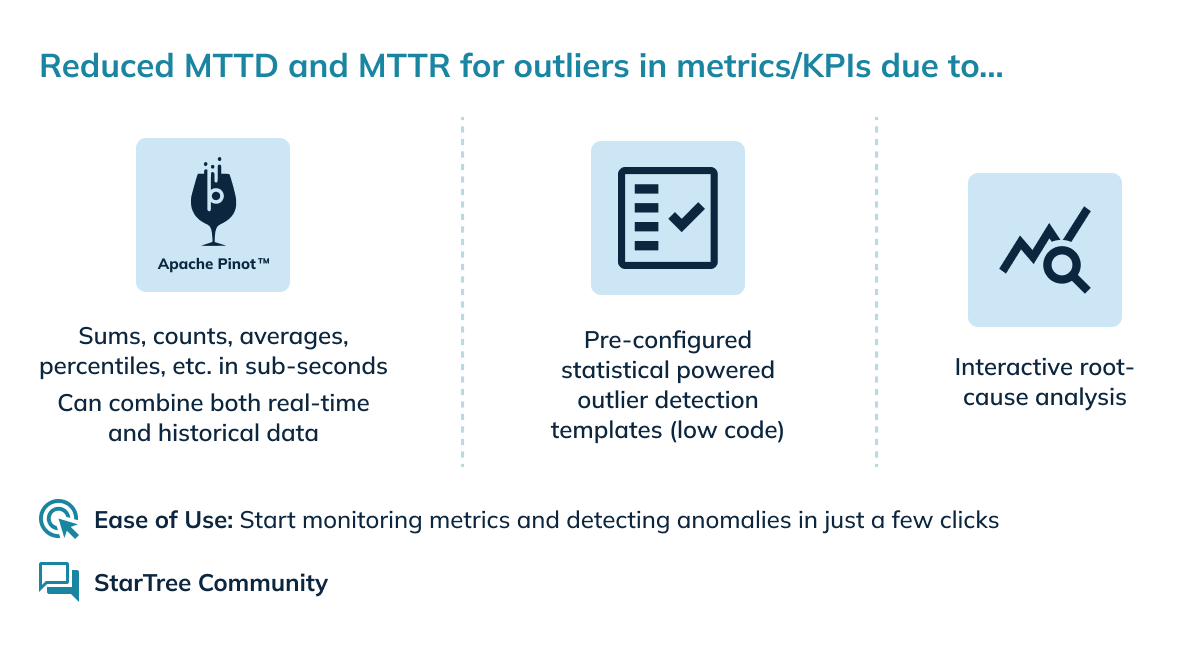
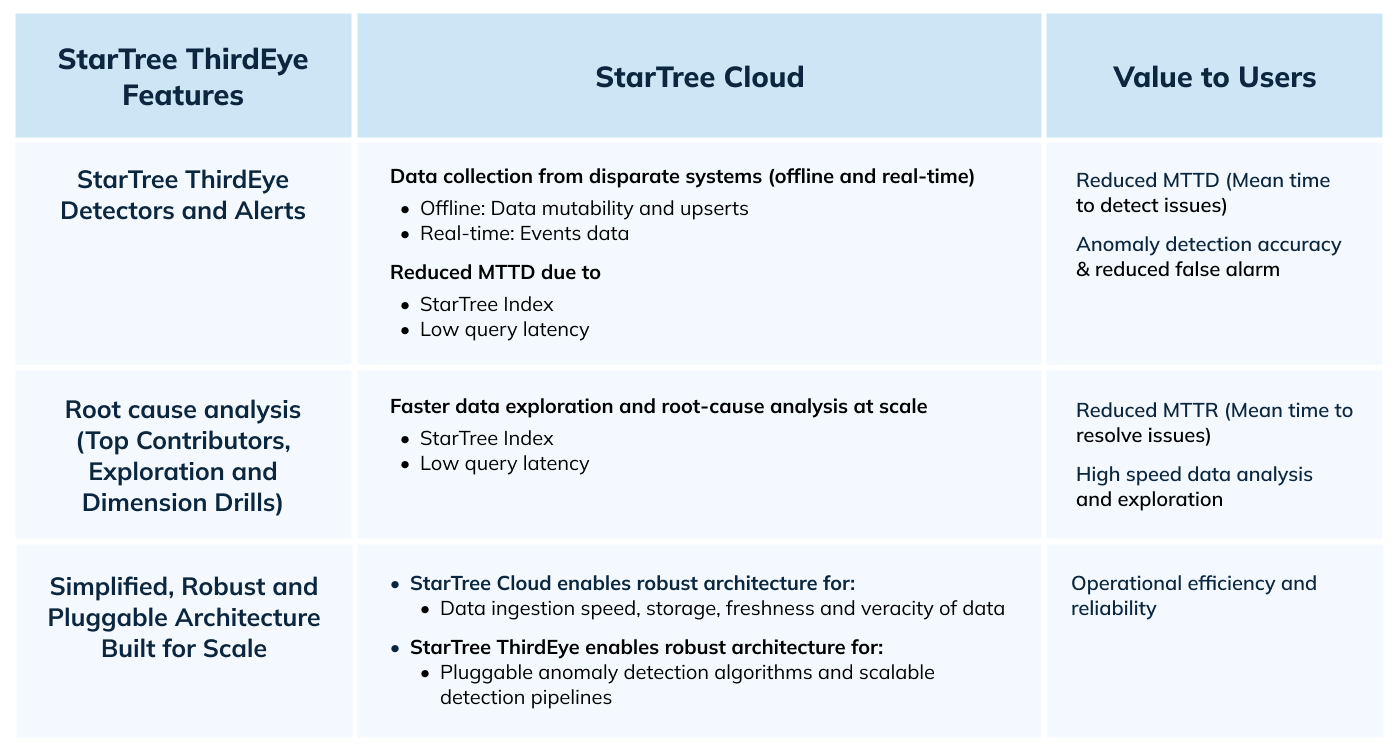
How is StarTree ThirdEye Special?
Let's Look at StarTree ThirdEye in Action
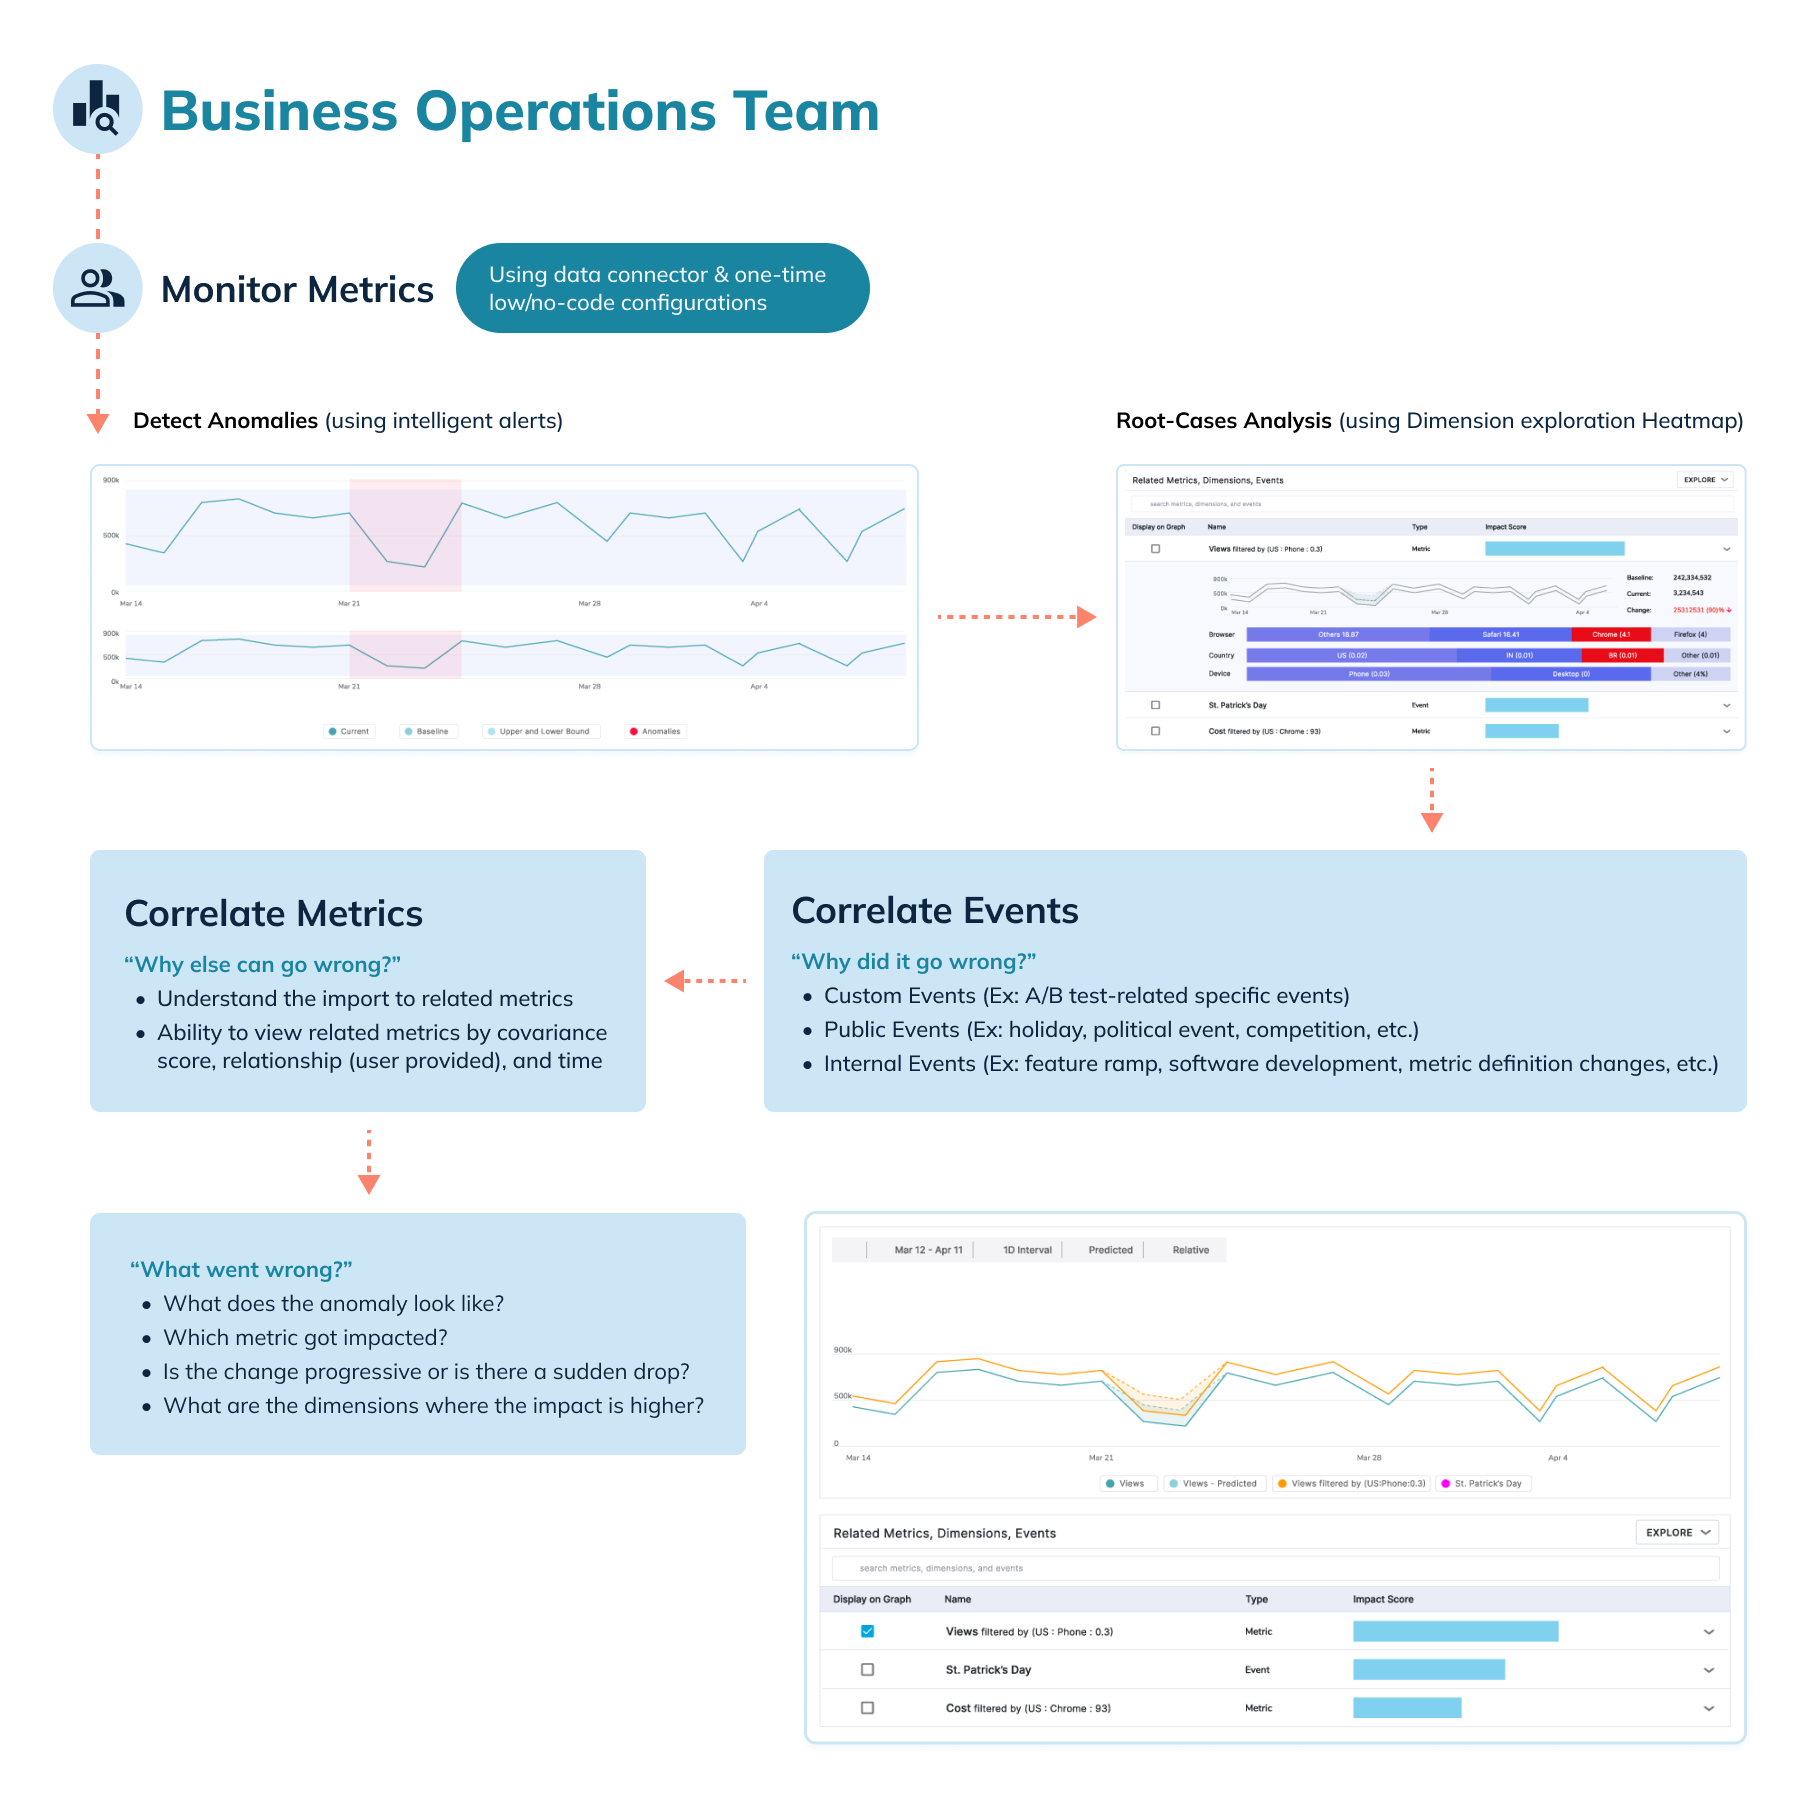
Here we walk through how StarTree ThirdEye enables a business operations team to improve decision-making by fast-tracking problem solving for outliers detected in business metrics and business data.
Let's assume that, in the last two weeks, the average number of responses for a public event suddenly dropped by 10% on mobile iOS platforms globally for a B2C event management company. The business operations team at the company is responsible for monitoring these critical business metrics, and they put together the following list of requirements:
They need to understand whether this is expected normal behavior or not.
If it's not expected, they need to know the potential reasons behind the drop.
Once the reason for the drop is found, the team needs to know what actions should be taken to restore the average number of responses KPI and to ensure business continuity and growth.

StarTree ThirdEye can help the business operations team monitor KPIs and perform root-cause analysis to take necessary actions to prevent any significant impact on the business:
Detailed Stepwise Solution using StarTree ThirdEye
Step-1: Leverage ThirdEye to collect data from disparate sources in real-time
As part of the business operations team, you can leverage StarTree Cloud and StarTree ThirdEye to connect to multiple data sources, collect all your events data in real-time, and then detect outliers in this massive scale of events data.
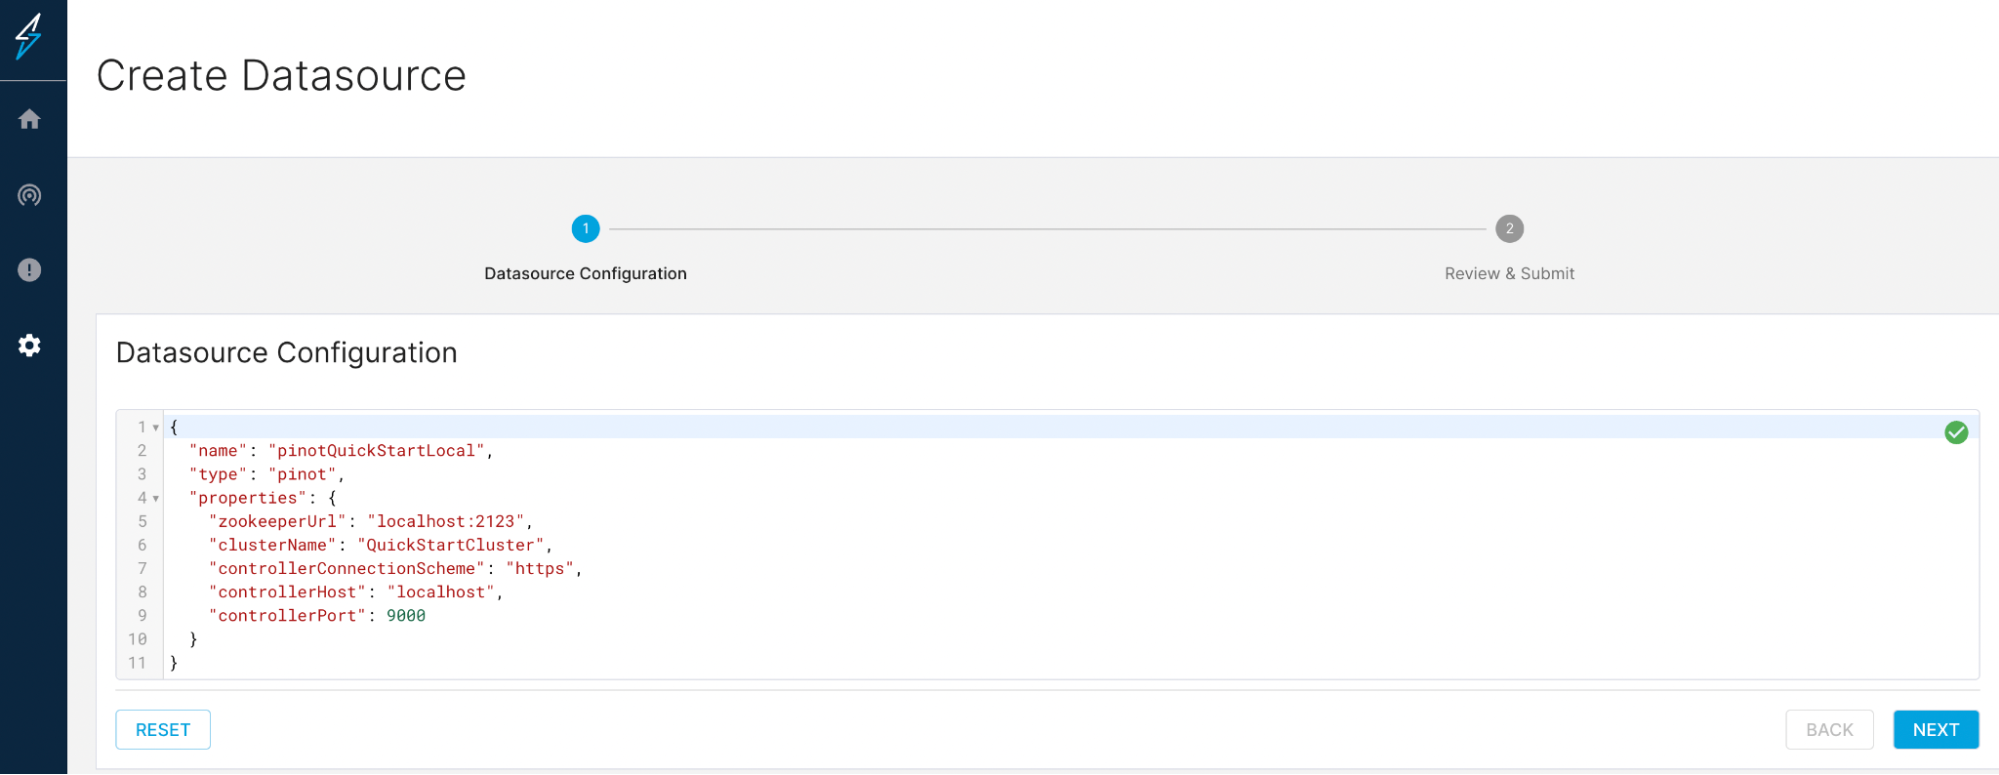
Create Datasource
Step-2: Understand what went wrong by identifying KPI pattern changes
With ThirdEye, you can use statistical detection techniques to find outliers with ease. Just plug and play, and in just a few clicks you can detect drops or spikes in the average number of time responses for the following types of outliers.
Global outliers (outliers far outside)
Contextual outliers (ex: seasonal data patterns)
Collective outliers (significant deviation from relative data points)
You can also use pre-configured alert templates built using various statistical anomaly detection techniques to detect anomalies in your time series data. You don't need to write any code or build or maintain any data pipelines for this.
You can use self-serve UI (with low-code/no-code experience) and pre-configured alert templates to identify KPI pattern changes on a time scale in an automated fashion.
During alert configuration, you can preview the anomalies and tune your alerts on the fly to get accurate results before saving the configuration and running your detection pipelines. This is a great cost saver for you.
You need to configure these alerts only once. From then on, anomalies will be generated and delivered to you through your preferred mode of communication at a regular interval determined by you.
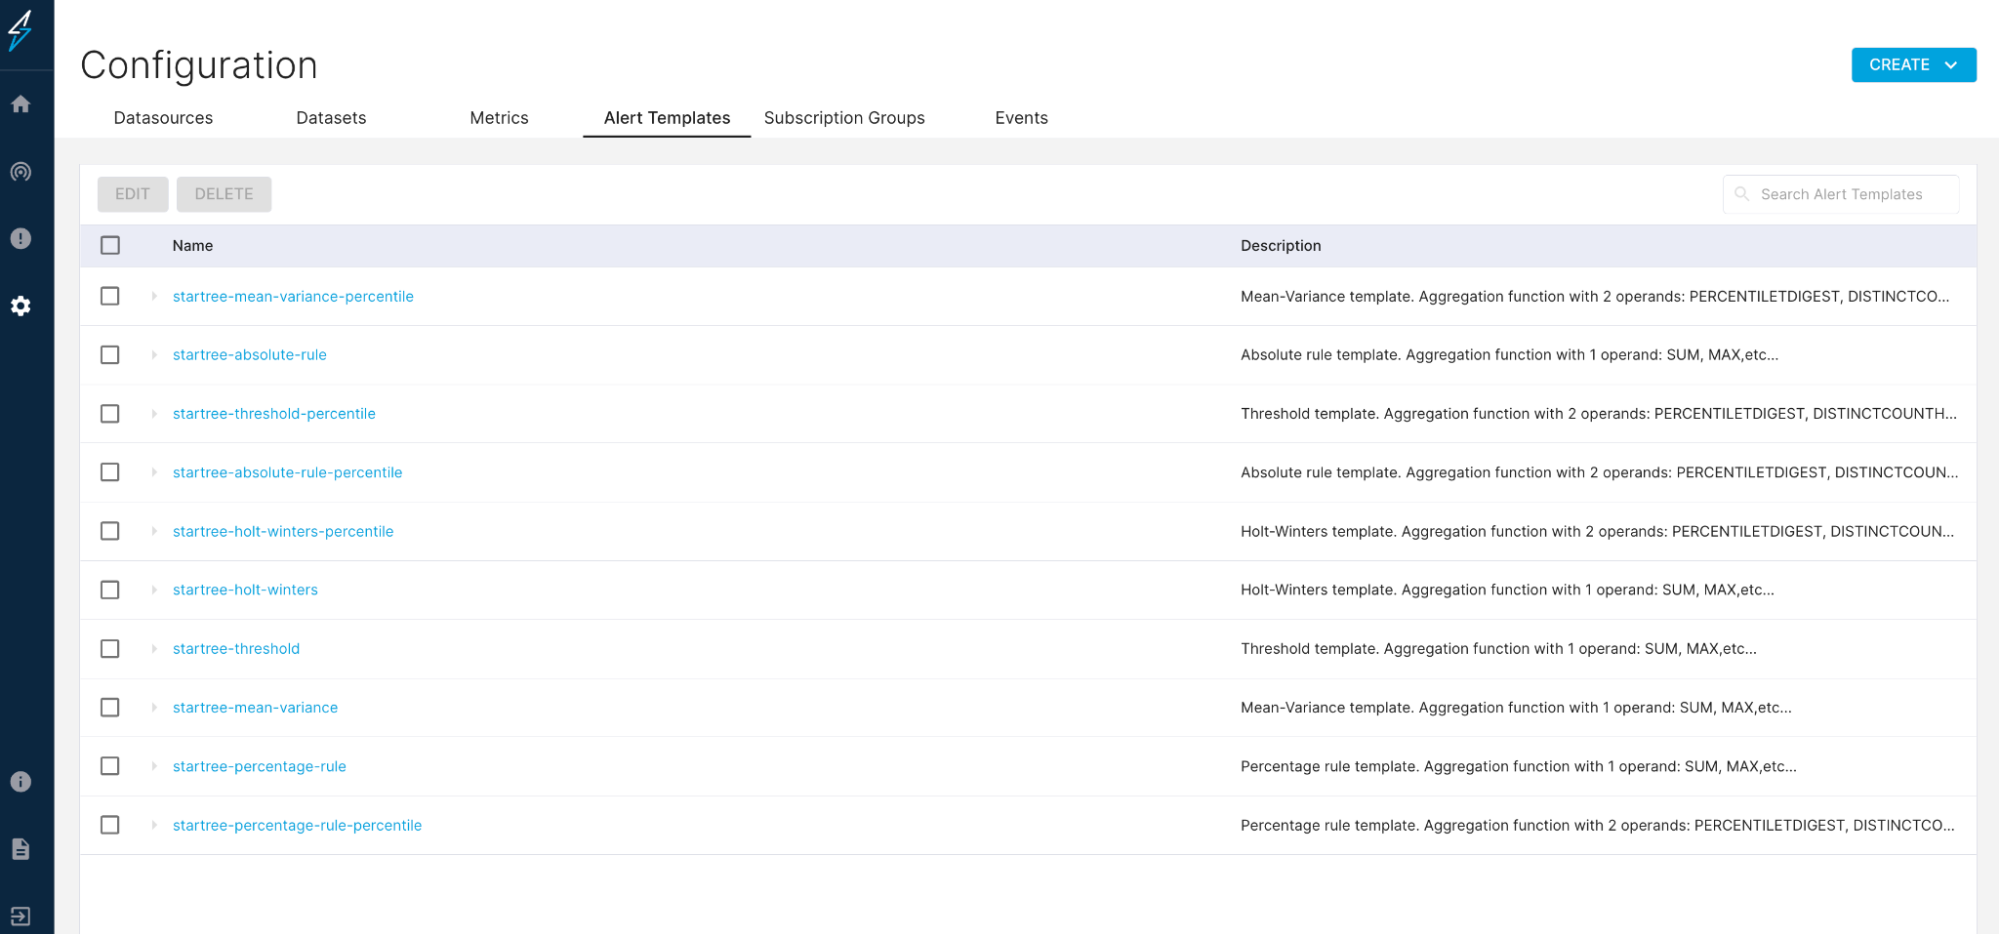
Configure Alert Templates
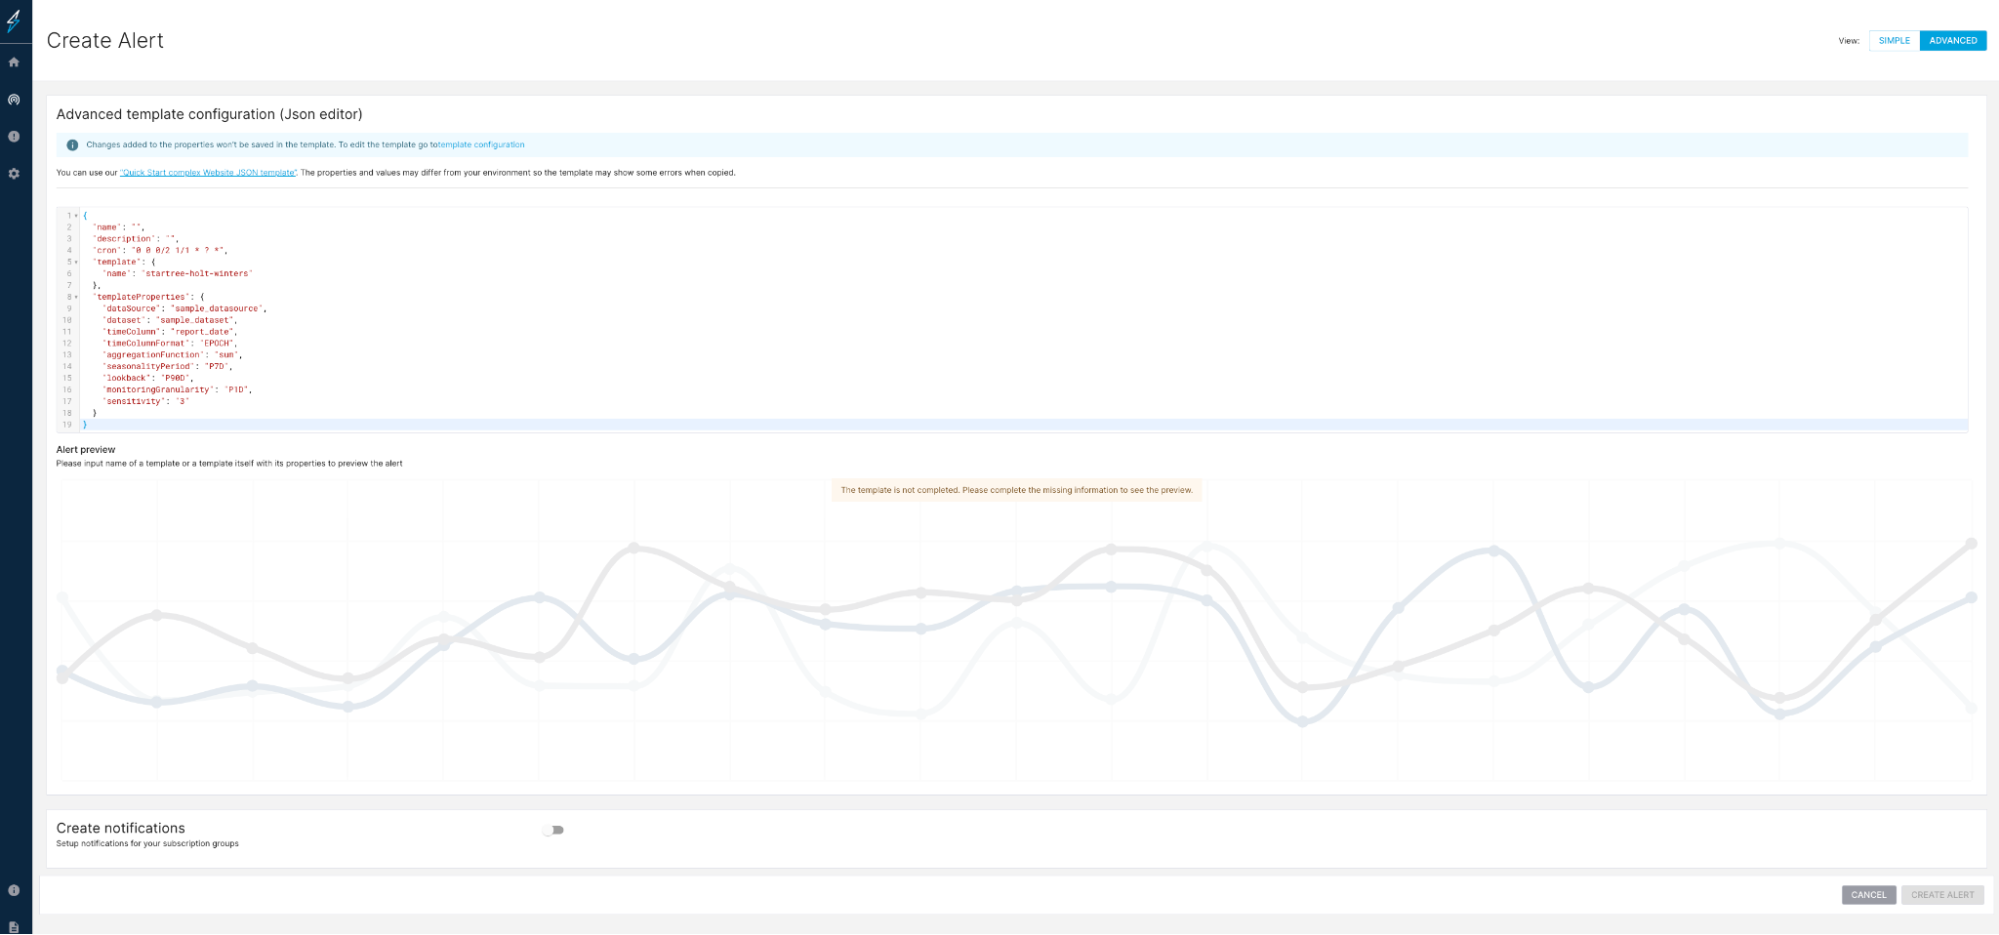
Create an alert using alert templates
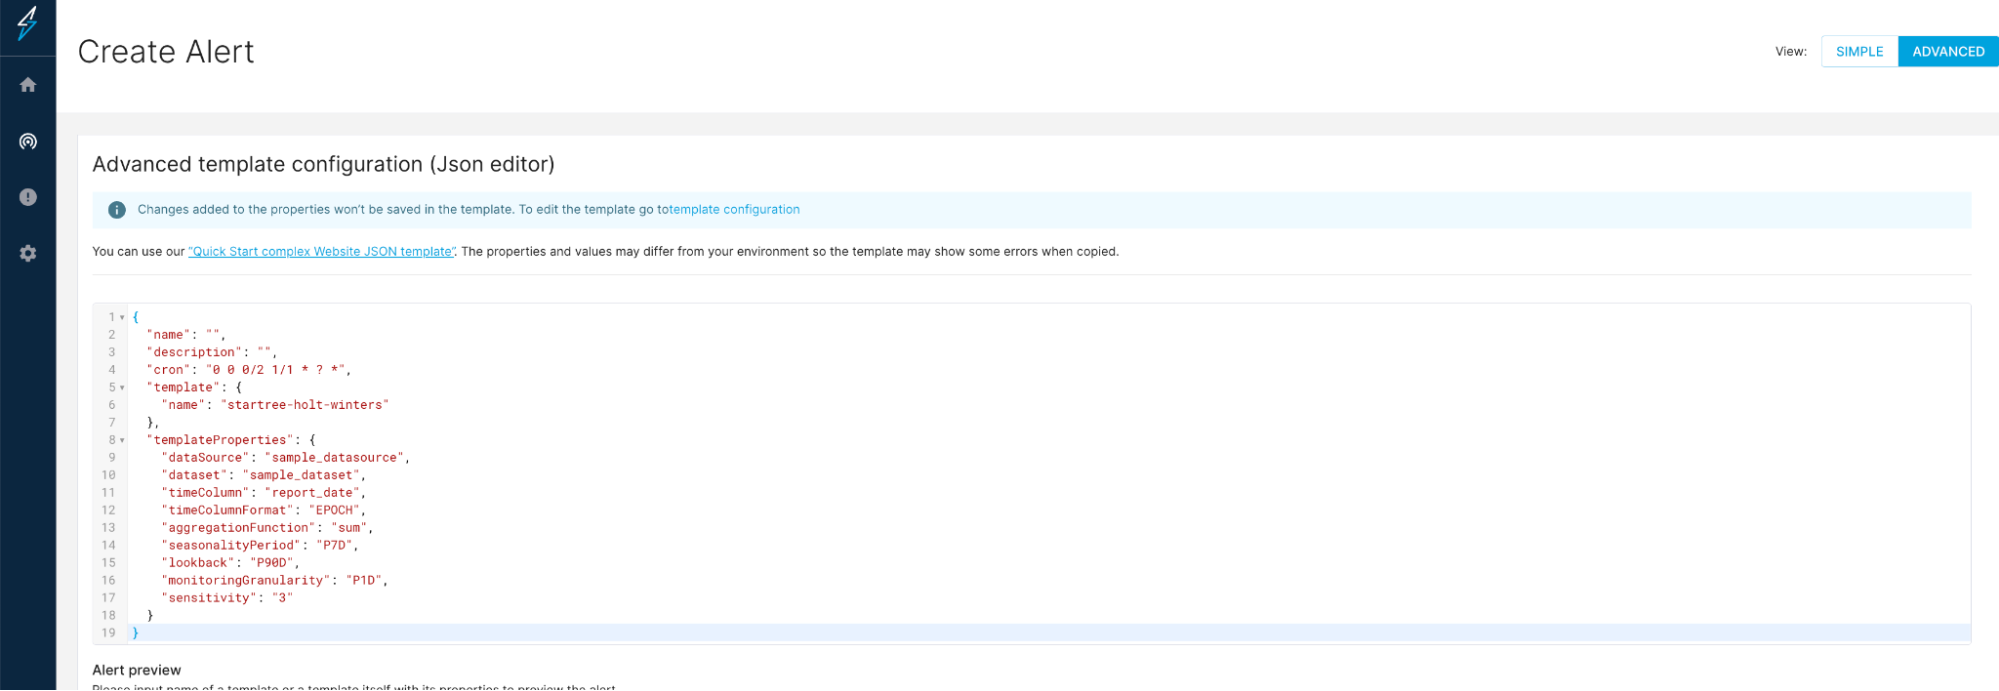
Create/edit an alert configuration using JSON editor
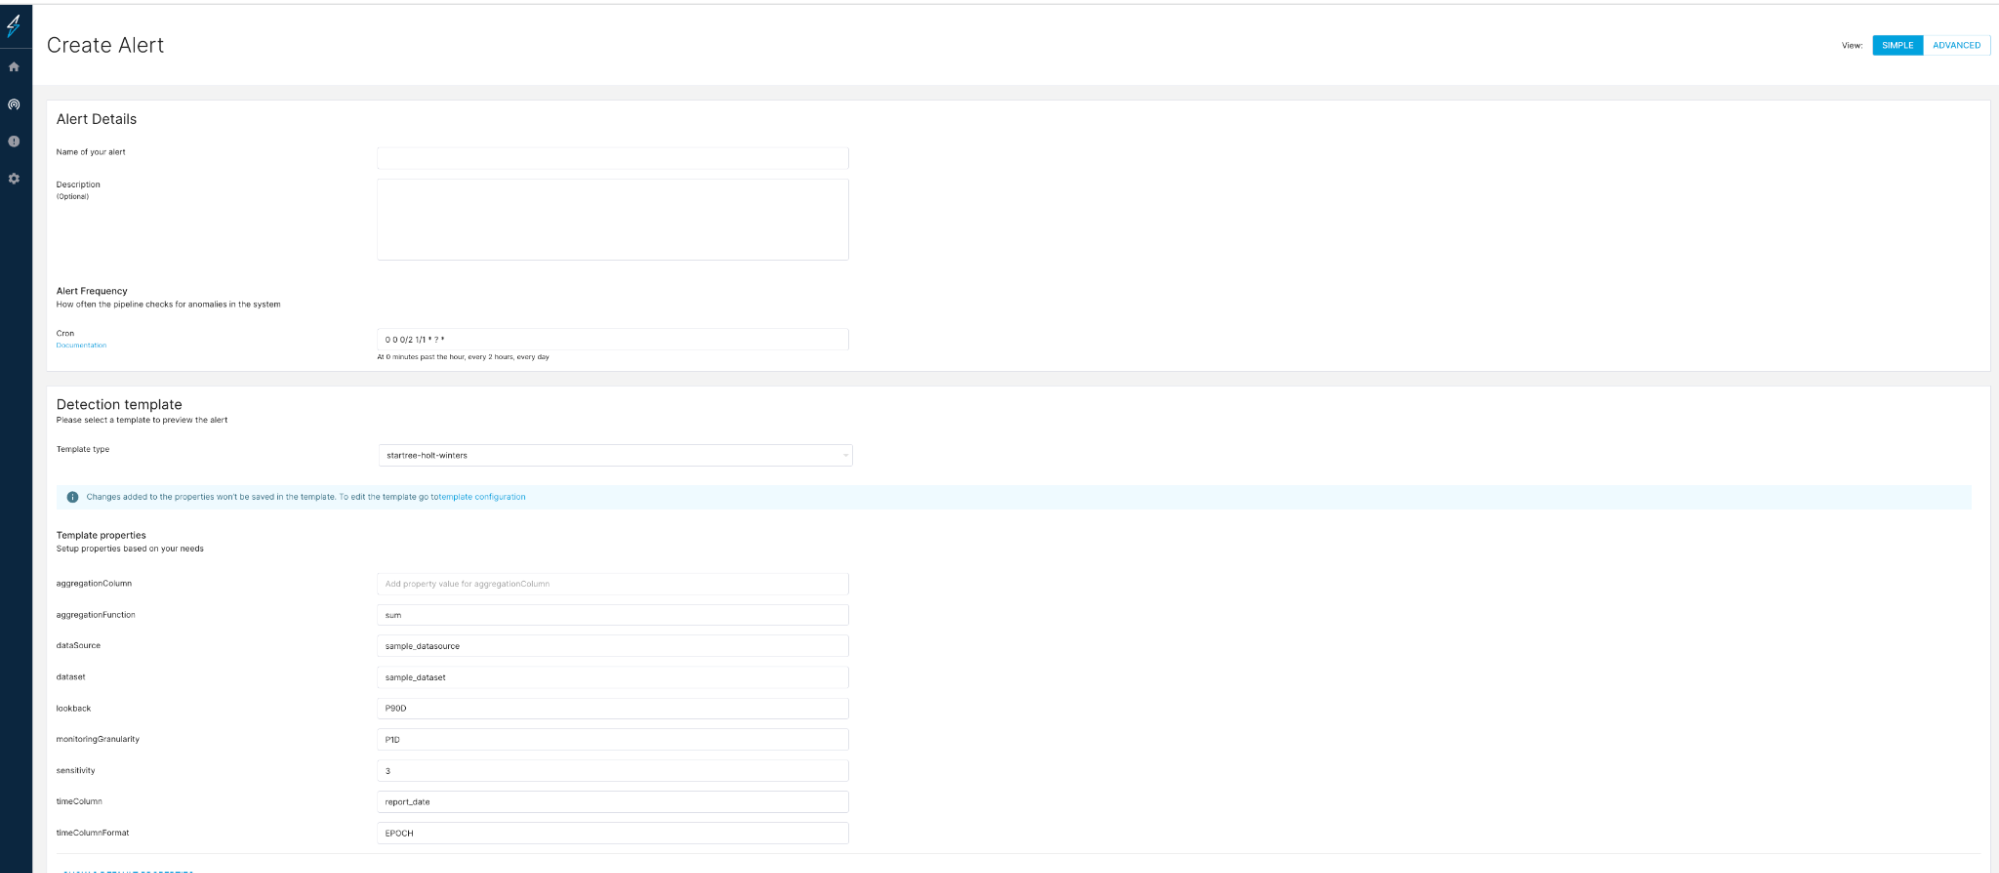
Create/edit an alert configuration using (no-code) UI
Step-3: Fast track your problem solving
With an anomaly detected, you can use interactive root-cause analysis to find out why the drop or spike in the average number of responses is occurring.
You can then identify the top contributors to the anomaly/outlier in your events KPI.
You can explore further by using an interactive investigation UI that shows a heatmap of correlated dimensions contributing to the anomaly. Using this view you can find answers to the following questions:
What is the anomaly?
What does it look like?
Which event KPI was impacted?
Is the change progressive, or is it a sudden drop?
Which are the dimensions where the impact is higher? (in a heatmap)
Which events caused the outlier in the KPI?
As part of the business operations team, you will be able to explore a variety events to get to the root cause of any KPI drop using StarTree ThirdEye, including:
Custom events (e.g., A/B tests)
Public events (e.g., holiday, political event, or competition)
Internal events (e.g., feature ramp, software deployment, and metric definition changes)
How can I understand the impact of related metrics in order to improve decision-making?
In the above example, let's assume that the insights in the investigation view of StarTree ThirdEye showed that a new feature launch on the events platform had caused the drop in the average number of times responses.
You might be interested to know the impact on guardrail metrics — so you can decide whether to continue to ramp the feature or not. Using the StarTree ThirdEye interactive investigation UI, you can also analyze the impact on correlated metrics. This will help you to make data-informed decisions and improve your decision-making.
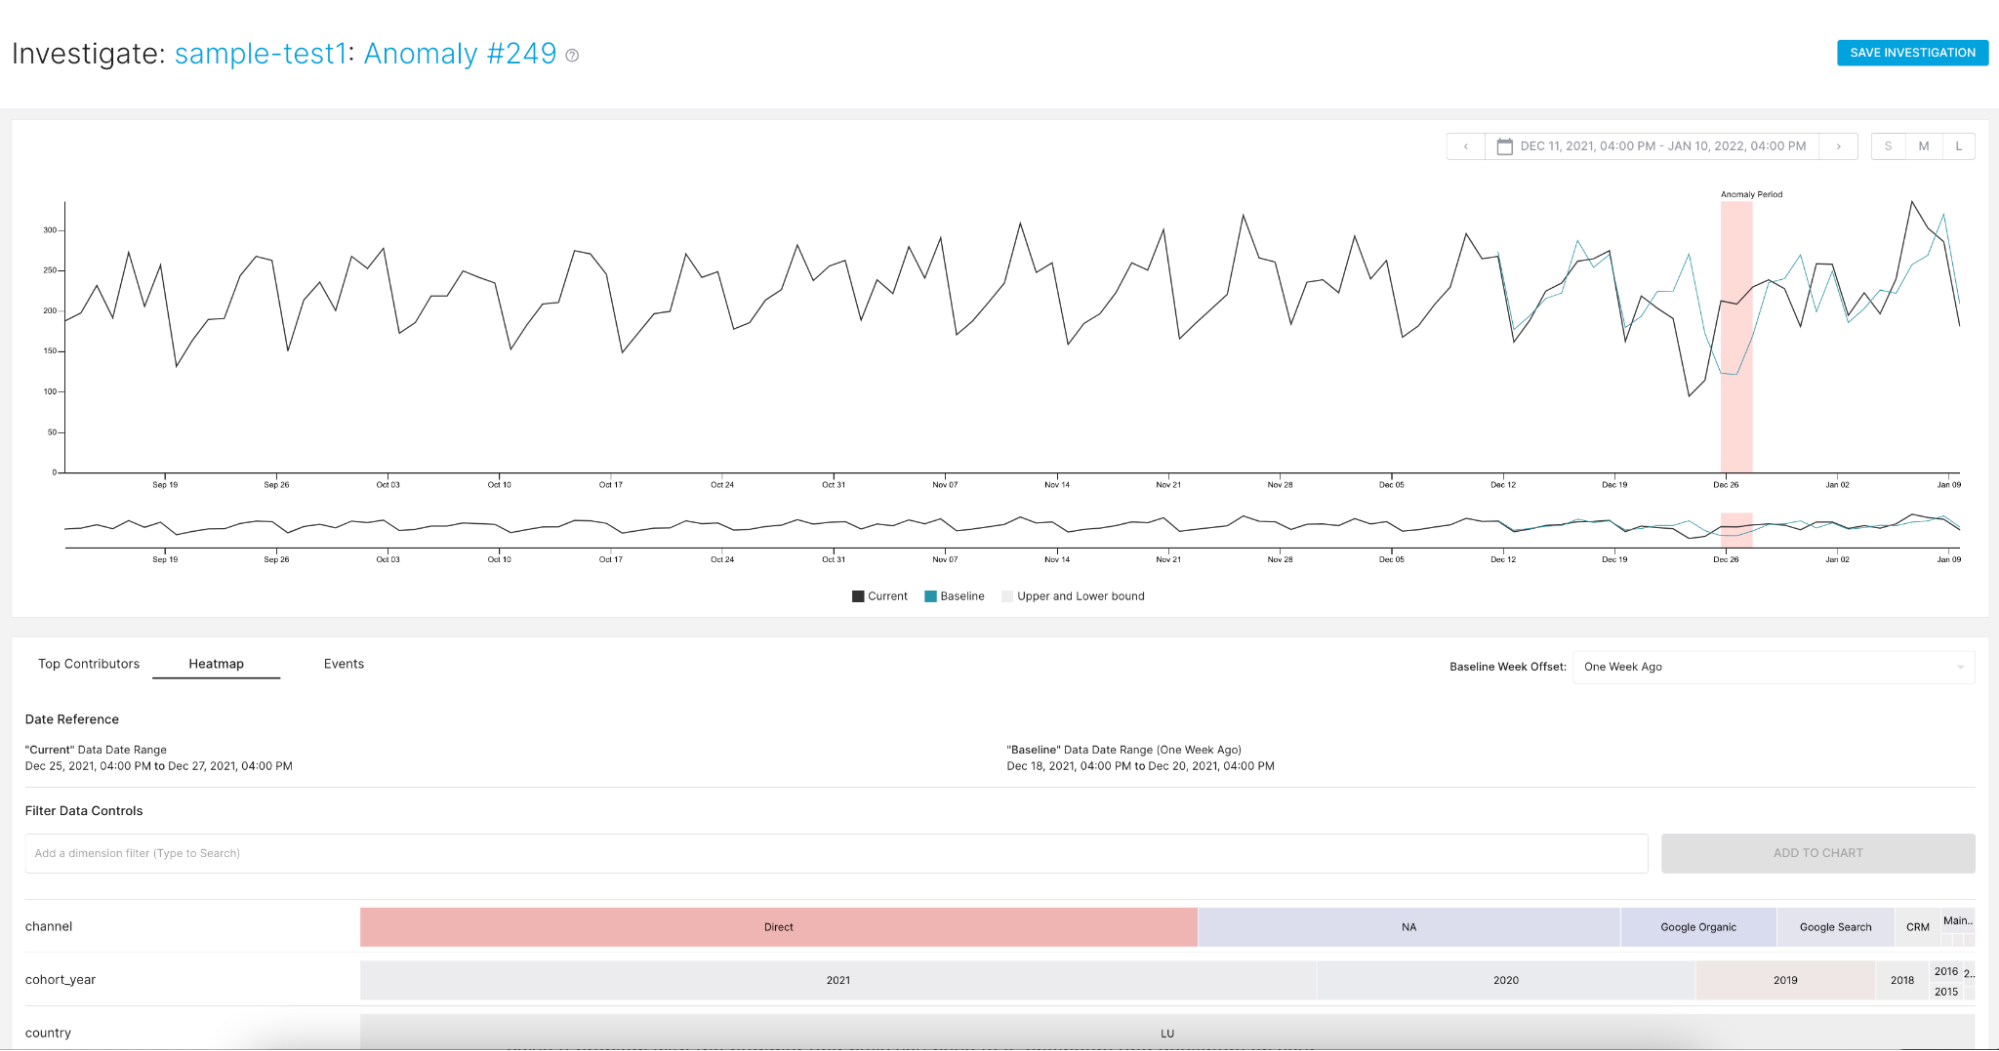
Heatmap to perform Root-cause analysis
StarTree ThirdEye is an all-in-one anomaly detection, monitoring, and root-cause analysis platform that helps you solve all these problems and many more.
Additional Use-Cases where StarTree ThirdEye Helps You Accelerate Decision Making

We detail a few more instances in which StarTree ThirdEye can provide critical visibility in order to fast-track problem solving and improve decision-making:
User-facing product KPIs observability
Monitor, detect, and resolve outliers in user-facing insights/KPIs such as detecting outliers in product catalogs so that merchants can ensure the product catalog is stocked, priced, and marketed well for their products.
Monitor, detect, and resolve outliers related to KPIs used to improve product experience or drive user growth for the consumer product. This would be applicable, for instance, to a new feature release or launch, or to software bugs or an increase in the number of active users that caused a sudden drop or increase in user engagement KPIs (ex: number of views, or number of monthly active users, or paid users).
Business KPIs observability
Monitor, detect, and resolve outliers in business-critical KPIs and identify key drivers impacting business KPIs. Picture a new, successful marketing campaign that increased leads or a promotional discount that drove up sales, or a price glitch affecting revenue.
Data quality KPIs observability
Monitor, detect, and resolve outliers in KPIs used to track overall data health and quality, such as a drop in data completeness, accuracy, or freshness, and compliance stats.
Systems KPIs observability
Monitor, detect, and resolve outliers related to KPIs used for ensuring the system health of a platform or product. Here we might be looking for potential spikes in cloud costs, cloud failure, infrastructure performance, etc.
Monitor, detect, and resolve outliers related to KPIs used to ensure IoT system health, such as a spike in performance, data volumes, or uptime.
Get Started with StarTree ThirdEye
Join Confluent, Walmart, and LinkedIn in using StarTree ThirdEye to unleash actionable insights. With all-in-one anomaly detection algorithms, monitoring, and root-cause analysis, the StarTree ThirdEye platform is fast, easy, reliable, flexible, scalable, and cost-effective.
Get in touch with StarTree by contacting us through our website. We encourage you to Book a Demo or contact us for a free trial.
Here are some great resources to help you get started. Please join our community Slack channel, or engage with us on Twitter at StarTree.
StarTree ThirdEye